Yahoo! Mobile ad services unable to connect

29 10 2008

I have been trying to test out Yahoo! mobile search advertising for a while now…

The first time I contacted them was at the end of September, I went to Yahoo!’s website and went into the advertisement options with the intention to set up a mobile search campaign. I started with the targeting options but soon I realised that in this process, I wasn’t going to be offered the possibility to set up my campaign for mobile. I went back to the website and found a UK telephone number to ring. A lady told me she couldn’t find anyone to help me at that moment, but she kindly took my phone number and told me someone would call me. That didn’t happen.

The second time I rang them was the beginning of October and this time I was given a telephone number in Barcelona (Spain). I was told that Yahoo!’s mobile division was based there. Since I’m Spanish, I rushed to call them and communicate in my mother tongue, unfortunately all I got was an answering machine. I left a message anyway, asking for somebody to call me, but that hasn’t happened yet either.

Last week I came across this url: http://mobile.yahoo.com. I went to find out if that was the place I could set up my mobile campaign on line. I pressed the Start Connecting button in the advertisers area, hoping to start my campaign straight away. Unfortunately all you can do there is fill a form showing your interest in mobile search advertising, and guess what…nobody has contacted me yet.

It has been a month and I have scoured two different websites and rang two different telephone numbers, with no results! Yahoo! is not making it easy to try their mobile search advertising program. Isn’t Yahoo! interested in the long tail advertisers?

I’m quite surprised about the long list of companies that don’t have an online sign up processes yet, especially since some smaller companies like Decktrade or Admob, let you set up a mobile advertising campaign in minutes. Companies like Yahoo! are shaping the future of mobile search and mobile advertising but are failing to provide basic information on how to get started. The least they could do is start phoning those who are eager to embrace mobile marketing.

Share add to del.icio.us Add to Blinkslist add to furl Digg it add to ma.gnolia Stumble It! add to simpy seed the vine TailRank post to facebook


Is mobile advertising an important part of your marketing strategy? Survey results

24 10 2008

Bango has recently carried out a survey within their customers to get some info about their mobile marketing activities and preferred mobile advertising networks.  I thought that as we have been analyzing results from the white paper I would share this data with you.

79 people completed the survey

And here are the results:

1) Is mobile advertising an important part of your marketing strategy?

73.4%  said YES
3.8% said NO
22.8%  said NOT AT THE MOMENT, BUT WILL BE IN THE FUTURE

2) Which mobile advertising networks/search advertising networks to you use?
(multiple answers allowed)

Google 86.7%
Yahoo! 26.7%
Adultmoda/Admoda 21.7%
Third Screen Media 16.7%
JumpTap 13.3%
Admob 13.3%
MoJiva 8.3%
Decktrade 5.0%
Getmobile.com 3.3%
Medio 3.3%
Mkhoj 3.3%
ZestAdz 1.7%
Itsmy.biz 1.7%

Other:
Such as 4thScreen, itext, DIYMAD, Quattro, Nokia Interactive, Develop myself

3) Do you measure the results?

67% said YES
33% said NO

It is quite impressive that 86.7% of the people that reply use Google and very surprising that 33% are not measuring results. Why wouldn’t you measure results on mobile advertising when it is such a measurable channel and there are tools out there to measure results for free? Bango’s mobile analytics can definitely help to explain what is happening with the ads and which ones are converting better. Even if it is just curiosity, wouldn’t you want to find out how many people has seen your ad?


“Mobile advertising for newbies” campaign results in Admob Analytics

22 10 2008

Let’s have a look to the result obtained in the 3 campaigns that we ran with AdMob analytics for the white paper. To be clear, these results cannot possibly be the same as the Bango mobile analytics results as I used Admob query string in the destination URL, which means that the users from this campaigns are different than the users that clicked on the campaigns ran with Bango’s tracking links.

Decktrade Google Mo’jiva

Visits 323

Average time spent 13 sec.

Bounce rate 96%

Visits 21

Average time spent 17 sec.

Bounce rate 90.48%

Visits 127

Average time spent 3 sec

Bounce rate 98.43%

Let’s dig down in Decktrade:

The number of visits doesn’t vary that much between the 3 days of campaign, 121 visits on Wednesday, 97 on Thursday and 107 on Friday. Unique visitors are not identified in this campaign, and the number of page views is slightly higher than the number of visits, as you can see in the graphic.

The figure that worries me is the Bounce Rate, as it is very high every day. I haven’t managed to understand how this bounce rate is calculated, so I really would like someone from Admob to explain. Basically with this campaign, between 94% and 98% of users left the site straight away, which is not good news for mobislim : ( . AdMob help says it is: Single page view visits divided by the total number of visits. I need help on this one!

Let’s see now the engagement information:

312 visits of the campaign stayed on the landing page between 0-30 seconds, 3 between 31-60 seconds, 5

Lenght of visit in Admob analytics

Lenght of visit in Admob analytics

between 61-180, between 181-600 seconds and someone forgot to leave and stayed more than 600 seconds!

The depth of the visit (number of pages viewed) was mostly down to 1 page view, with 11 visits going around the site to find out more, as you can see in the graphic.

The loyalty (number of visits per user) tells me that only 2 users came more than once to the site and the visit interval (number of days since last visit) tells me that 324 visits are new.

Let’s have a look at the geo stats:

249 visits come from the US, 4 from the UK, both my target countries, and 70 visits came from a variety of countries that I wasn’t targeting. This means that 22% of my traffic didn’t come from my target countries.

Regarding operators, my most popular one was WIFI in United States with 76 visits, which means either a PC or a mobile phone getting to mobislim.wap.com through a WIFI connection in the US. I have 46 visits for unknown operators but they do say they are mobile, and another 46 from AOL. The list continues with different operators from different countries.

My top handset manufacturers were Nokia with 98 visits, Microsoft PC with 66, and Generic Windows Mobile with 45, followed by Motorola 24 and SonyEricsson 18.
What have I learnt from this results:

1.    The level of engagement is not very high but on the other hand the landing page had a clear call to action that was to download the chart, and you only need 4 seconds to read the message on the page…so maybe they just went straight away to download the chart and left the site afterwards looking for more content. We’ll try to measure conversion rates in future occasions.
2.    Targeting countries doesn’t seem to have such a great effect as 22% of my traffic came from countries I didn’t target.
3.    PC traffic is a big percentage of my traffic, I’m seriously starting to consider to expand Mobislim in to the PC world : )
4.    Generic windows mobile are 3rd in the rank, which means smartphone, I will consider this when planning my next campaign.

Let’s have a look now to Google:

The number of visits is higher on the Thursday (10) and Friday (7) than on Wednesday (4), with slightly higher number of page views on the Friday. Unique visitors are not shown for this campaign.

The level of engagement is showing me that 19 of the 21 stayed on the page between 0 and 60 seconds. In this campaign the first time interval is of 1 minute while in the Decktrade campaign was 30 seconds, I imagine the reason for this is the smaller number of visitors. The depth of visit says that 19 viewed 1-2 pages, 1 visited between 3 and 5 and 1 more than 6. All of the visits were new visits.

Let’s have a look at the geo stats. My 21 visits come from the US…hmmm, nobody looking for my keywords

Top operators from Google campaign in Admob analytics

Top operators from Google campaign in Admob analytics

in the UK? The 3 top operators are AT&T, Cricket Wireless and Sprint, and the top devices are, if I look to the manufacturer RIM, Palm and Motorola, looking the rest on the list and the models, mostly are smartphones.

My take in this Google campaign:

1.    Smartphones seem to be the kind of handsets that search the mobile internet the most.
2.    UK users don’t seem to be looking for burning calories keyword related terms on the mobile web

And to finish this post let’s have a look at Mo’jiva. The number of visits was 127 with more visits on the Thursday and the Friday. From an engagement point of

Visits recorded from the Mo'jiva campaign

Visits recorded from Mo'jiva in Admob anlaytics

view, this campaign is pretty similar to the other ones except for the average time spent that was 3 sec. This a bit too low from my point of view. Let’s see the geo stats – my top 3 countries were India (82), US (19) and Nigeria (10). My top 3 operators are Airtel Cellular India, Desktop in India and MTN Nigeria. My top 3 device manufacturers were Nokia (47) Microsoft PC (21) and Unknown (18).

What I have learnt from this campaign:

1.    I think that something must be not working well as the average time spent –  3 seconds – is quite low.
2.    2 of my top 3 countries were not on my target list, and only 19 visits came from one of my target countries. This means that only a 15% of the traffic was relevant to my campaign.
3.    PC is still a winner form Mobislim! : )

Share: add to del.icio.us Add to Blinkslist add to furl Digg it add to ma.gnolia Stumble It! add to simpy seed the vine TailRank post to facebook


“Mobile advertising for newbies” campaign results in Bango Mobile Analytics

21 10 2008

Here are the results of the campaigns that Peggy and I ran for the white paper “Mobile advertising for newbies”. This results were collected in Bango mobile analytics.

The budget was $15 (£10), they ran for 3 days and the creative was the same for all three campaigns.

As it is explained in the white paper, the results from Bango mobile analytics come from a tracking link that we created in the Analytics center, and the results from AdMob analytics come from a query string added to the destination url.

This means we were running 6 campaigns.
So let’s have a look to the data we got through Bango after 3 days of campaign:

Decktrade Google Mojiva

270 page views

184 unique visitors

6 unique countries

21 unique operators

62 unique devices

18 page views

17 unique visitors

3 unique countries

11 unique operators

13 unique devices

81 page views

72 unique visitors

4 unique countries

12 unique operators

33 unique devices

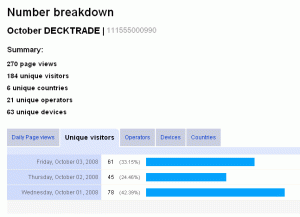
Looking at Decktrade it seems that the most active day – with more page views (106) and unique visitors

Decktrade campaign unique visitors in Bango mobile analytics

Decktrade campaign unique visitors in Bango mobile analytics

(78) – was Wednesday, the first day of campaign. If we look at the countries, the majority of my traffic comes from US (39.26%) with only 1.85% of traffic coming from the UK. Both were the target countries. Some traffic came from countries I didn’t target and  as Peggy says in the white paper, it is great to see that mobile traffic is coming from everywhere  but I wonder how this would affect large scale campaigns. In our case, the proportion of traffic coming from non-target countries ((India, Indonesia and Nigeria) was only 4%.

A fair percentage of countries is unidentified (55%), so I go and check the device data. I can see that there is quite a lot of traffic coming from PC browsers, which closely matches the percentage of countries unidentified. So here we go, PC traffic doesn’t offer me operator info (because there isn’t one involved) or country data as accurately as mobile traffic because the way PC browsers and cookies work on the PC world…
Let’s see which was the most popular mobile device, and surprise, surprise that was the Apple iPhone, followed by the Nokia 6300 and the SonyEricsson P1i. The most popular operator was AOL USA, bringing 24% of the traffic.

Here are my thoughts after checking these results:

1. If half of my traffic is coming from a PC maybe I should think in creating a PC web version of Mobislim :).
2. Decktrade gives me great results in the US market but seems less effective in the UK.
3. When people access the site from a mobile phone, I can really tell where they come from, through which operator, if I have seen then before and if they converted.

Now let’s see what we learn from out Google campaign: The first thing I notice is how much smaller the

Most popular devices from the Google campaign

Most popular devices from the Google campaign

numbers are. Taking into consideration that Bango counts every single unique visitor that comes through, 17 in 3 days doesn’t seem such a big deal. But again, this is early days for everybody, maybe my selection of keywords wasn’t so great or people are actually burning calories instead of looking for ways to burn them :).
Friday is the day for search, 47% of the unique visitors came this day, 29% of Thursday, and 23% on Wednesday. Take this into consideration when planning your campaigns, when is your public more likely to be searching for you? Put the big bucks on that time frame…

With the target countries there is no problem this time; 83% of the traffic comes from the US and 11% from the UK. Is the US more active in the mobile search arena or simply more worried about burning calories? I leave that one up to you! We saw more traffic coming from Cricket USA, followed by Verizon USA and T-Mobile, and for the most popular handset we have an even mixture between Blackberries, Motorolas and Samsungs.

Things to think about for my next search campaigns:
1. Time of the week people will look for my content
2. Make a better and wider selection of keywords and maybe spare a few more pennies on my bids so I get to show up first

And last but not less, is time now to look at the results on the Mojiva campaign. As Peggy mention in the

Top operators from the Mojiva campaign

Top operators from the Mojiva campaign

with paper, this campaign didn’t run on the same days as Google and Decktrade, so I’m taking the result from a previous campaign, that ran from the 26th to the 28th of September, with exactly the same budget and the same creative. It is going to be interesting to see if the results over the weekend change much in comparison with the same campaign run in weekday with AdMob. Let’s focus now in Bango results.

Unique visitors were almost the same on Friday (32) and Sunday (30) and a third on Saturday (10). The most popular operator was Metro PCS USA with 27% of the traffic but again, PC traffic seems to be quite significant (31%)  Our top devices here are Samsung R210 and Motorola GATW. 51% of the traffic came from the US, 10% of the traffic from countries I didn’t target (India and Iraq) and the rest is the PC traffic I mention before.

My take: This ad network works well for the US, but the extra pennies I had to pay to target the UK haven’t brought me any ROI. I’ll follow progress with them to see when the increase their inventory in the UK.

If you want to have a look yourself and get you own conclusions of these campaigns you can visit our Analytics Center, just follow this simple instructions:

1.    Go to http://bango.com
2.    Login as demo@bango.com and password demo
3.    Click on Analytics center

Share add to del.icio.us Add to Blinkslist add to furl Digg it add to ma.gnolia Stumble It! add to simpy seed the vine TailRank post to facebook


Mobile advertising companies and other ad networks…

14 10 2008

Here are some more mobile advertising companies that complete the list provided in the white paper “Mobile adverting for newbies” that you can download at bango.com/whitepaper. If you come across any more companies that would like to add to the list, juts let me know!

4th Screen Advertising – www.4th-screen.com
Ad Infuse – www.adinfuse.com
Add2Phone – www.add2phone.com
AditOn – www.aditon.com
Aerodeon – www.aerodeon.com
Amobee – www.amobee.com
Anam – www.anam.com
Celltick – www.celltick.com
Digital Sidebar – www.digitalsidebar.com
Frog2Frog – www.frog2frog.com
Goldspot Media – www.goldspotmedia.com
Inside Mobile – www.insidemob.com
MMCast – www.mmcast.net
Mobisix – www.mobisix.com
Que Pasa – www.que-pasa.co.uk
ScreenTonic – www.screentonic.com
Utarget – www.utarget.co.uk
Unanimis – www.unanimis.co.uk

Share   add to del.icio.us Add to Blinkslist add to furl Digg it add to ma.gnolia Stumble It! add to simpy seed the vine TailRank post to facebook


“Mobile advertising for newbies” ready to download!

14 10 2008

I’m very pleased to announce that the white paper “Mobile advertising for newbies” is now ready to download at http://bango.com/whitepaper.

What’s next: "Mobile advertising for newbies" ready to download

– I’ll be posting some other ad networks and mobile advertising companies to complete the list shown in the white paper very shortly.

– I’ll post a detailed analysis of the 3 campaigns we ran for the white paper.

Watch this space as many mobile advertising experiments are coming up.

Also, I would like to encourage everybody to send me questions of anything that you would like to try but don’t know how, or have the mobile site for. Mobislim is here exactly for that, to help you understand the mobile advertising and mobile analytics marketplace.

I would like to congreatulate Peggy Anne Salz (http://msearchgroove.com/) for the fantastic job you she has done writing this white paper, and a very special thank you to Tom Thurston (http://themobiledeveloper.com/) for keeping a close eye on Mobislim site and always making things happen.

Enjoy!

Share  add to del.icio.us Add to Blinkslist add to furl Digg it add to ma.gnolia Stumble It! add to simpy seed the vine TailRank post to facebook


How I use mobile analytics to measure mobile advertising II Part

3 10 2008

I said last week in my post ”How I use mobile analytics to measure mobile advertising” that I would report back the results of the campaign I run on Decktrade. As the Decktrade campaign didn’t start running at the same time as the Google and Mojiva campaigns, I decided to keep these two running, so I would obtain results based on the same dates.

For $5 daily budget, campaigns running from the 22nd to the 26th of September and using
Bango mobile analytics to measure results,  the results are:

Decktrade

Google

Mojiva

293 page views

228 unique visitors

27 unique countries

46 unique operators

107 unique devices

117 page views

85 unique visitors

13 unique countries

27 unique operators

44 unique devices

75 page views

63 unique visitors

3 unique countries

11 unique operators

28 unique devices

Looking at the page views and unique visitor results, what I see is that Decktrade gives me a considerable higher number of repeat visitors, and a higher number of clicks on my ad. This makes me  think they have a much bigger network than Mojiva, which reports a quarter of those clicks for the same amount of money. Google’s results are more difficult to judge because they do depend on my selected keywords, and rather than general browsing on the mobile web, they reflect the amount of people actively searching for my selected keywords. Overall it’s great news for mobile marketers because it proves that people are searching on the mobile web.

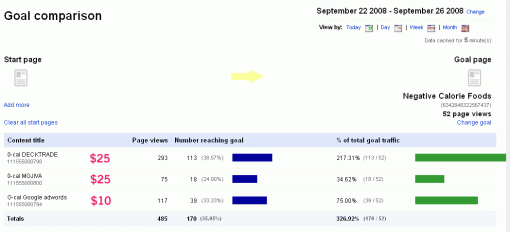
Now, let’s have a look at the conversion rates: the objective of this campaign was to download a free chart. Let’s see what we got:

Bango mobile analytics goal comparison feature

Bango mobile analytics goal comparison feature

Overall I’m VERY happy to see an average conversion rate of 35.05%. Decktrade performed very well with a 38.57%, Mojiva 24% and Google 33.33%. Now, the real point of this is to check those conversions* against the money I spent on the campaigns. I have added those figures in pink. And who is my winning campaign on this occasion? That would be Google, because even though the conversion rate wasn’t the best of the 3 it turns out that I only paid $10 for those conversions, and $25 for the others.
Does this mean that Google is better than Decktrade or Mojiva? Absolutely not! The only thing that tells me is that when people initiate a conversation they are more proactive in engaging with your brand because your ad is relevant to the purpose of their search.

Relevancy = Success and better ROI.  When planning your next campaign think twice when choosing the categories you want to put your ad on and get a mobile analytics tool that gives you an X-ray of your visitors and your conversions.  This means you know how to talk to your potential customers the next time you get the chance to engage with them.

*I said last week that I didn’t have any conversions, and in fact I did, Bango analytics wasn’t synchronizing the info properly, but that is fixed now and I was able to go back and capture that data….and I’m so happy about it! 35% average conversion rate!!!

Share   add to del.icio.us Add to Blinkslist add to furl Digg it add to ma.gnolia Stumble It! add to simpy seed the vine TailRank post to facebook