AdMob and Admoda, which ad network converts better?

18 12 2008
Landing page for the campaign

Landing page for the campaign

I just run two parallel mobile advertising campaigns, one with AdMob for $100, as it is their minimum daily budget, and another one with Admoda for £50. The message was: FREE downloads to stay SLIM! – as you can see below, it was quite successful ;-). Target countries were the US and UK (although both ad networks sent me traffic from many more countries that the ones I wanted to target…)

The landing page contained 3 different tables ready to download to your mobile:
– Calories by drink
– Negative calorie foods
– Calories burnt by activity

Aren’t you curious to know which one was the most popular download? Let’s have a look at the results tracked by Bango mobile analytics!

Here is a quick summary:
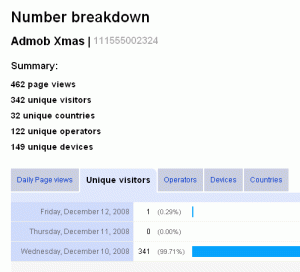
Admob results by Bango Analytics

Admob results by Bango Analytics

Admoda results by Bango Analytics

Admoda results by Bango Analytics

Now let’s have a look to the conversion rates with the goal comparison feature, which tell us from each campaign, how many people downloaded any of the calorie charts.

And the winner is….

Alcohol calories chart conversion rate

Alcohol calories chart conversion rate

Calories by activity chart conversion rate

Calories by activity chart conversion rate

Negative calorie food chart conversion rate

Negative calorie food chart conversion rate

So, AdMob total conversion rate was an average of 16.88% and Admoda reported a 25.26% conversion rate. These are quite high conversion rates, but I guess that making the content available for free and with the Xmas “fattening” season so close, people are a bit more conscious about these things!

If your curiosity knows no limits and you would like to see which countries are downloading which charts, and what devices or operators are more popular, go and check the results on our demo account. The tracking links you want to look at in the Campaign section of Bango Analytics are:
– Admob Xmas
– Admoda Xmas

Merry Xmas and happy mobile browsing for 2009!

Maria

Share: add to del.icio.us Add to Blinkslist add to furl Digg it add to ma.gnolia Stumble It! add to simpy seed the vine TailRank post to facebook


How I use mobile analytics to measure mobile advertising II Part

3 10 2008

I said last week in my post ”How I use mobile analytics to measure mobile advertising” that I would report back the results of the campaign I run on Decktrade. As the Decktrade campaign didn’t start running at the same time as the Google and Mojiva campaigns, I decided to keep these two running, so I would obtain results based on the same dates.

For $5 daily budget, campaigns running from the 22nd to the 26th of September and using
Bango mobile analytics to measure results,  the results are:

Decktrade

Google

Mojiva

293 page views

228 unique visitors

27 unique countries

46 unique operators

107 unique devices

117 page views

85 unique visitors

13 unique countries

27 unique operators

44 unique devices

75 page views

63 unique visitors

3 unique countries

11 unique operators

28 unique devices

Looking at the page views and unique visitor results, what I see is that Decktrade gives me a considerable higher number of repeat visitors, and a higher number of clicks on my ad. This makes me  think they have a much bigger network than Mojiva, which reports a quarter of those clicks for the same amount of money. Google’s results are more difficult to judge because they do depend on my selected keywords, and rather than general browsing on the mobile web, they reflect the amount of people actively searching for my selected keywords. Overall it’s great news for mobile marketers because it proves that people are searching on the mobile web.

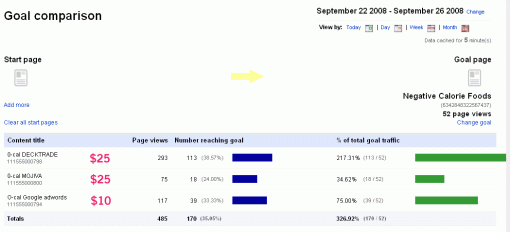
Now, let’s have a look at the conversion rates: the objective of this campaign was to download a free chart. Let’s see what we got:

Bango mobile analytics goal comparison feature

Bango mobile analytics goal comparison feature

Overall I’m VERY happy to see an average conversion rate of 35.05%. Decktrade performed very well with a 38.57%, Mojiva 24% and Google 33.33%. Now, the real point of this is to check those conversions* against the money I spent on the campaigns. I have added those figures in pink. And who is my winning campaign on this occasion? That would be Google, because even though the conversion rate wasn’t the best of the 3 it turns out that I only paid $10 for those conversions, and $25 for the others.
Does this mean that Google is better than Decktrade or Mojiva? Absolutely not! The only thing that tells me is that when people initiate a conversation they are more proactive in engaging with your brand because your ad is relevant to the purpose of their search.

Relevancy = Success and better ROI.  When planning your next campaign think twice when choosing the categories you want to put your ad on and get a mobile analytics tool that gives you an X-ray of your visitors and your conversions.  This means you know how to talk to your potential customers the next time you get the chance to engage with them.

*I said last week that I didn’t have any conversions, and in fact I did, Bango analytics wasn’t synchronizing the info properly, but that is fixed now and I was able to go back and capture that data….and I’m so happy about it! 35% average conversion rate!!!

Share   add to del.icio.us Add to Blinkslist add to furl Digg it add to ma.gnolia Stumble It! add to simpy seed the vine TailRank post to facebook